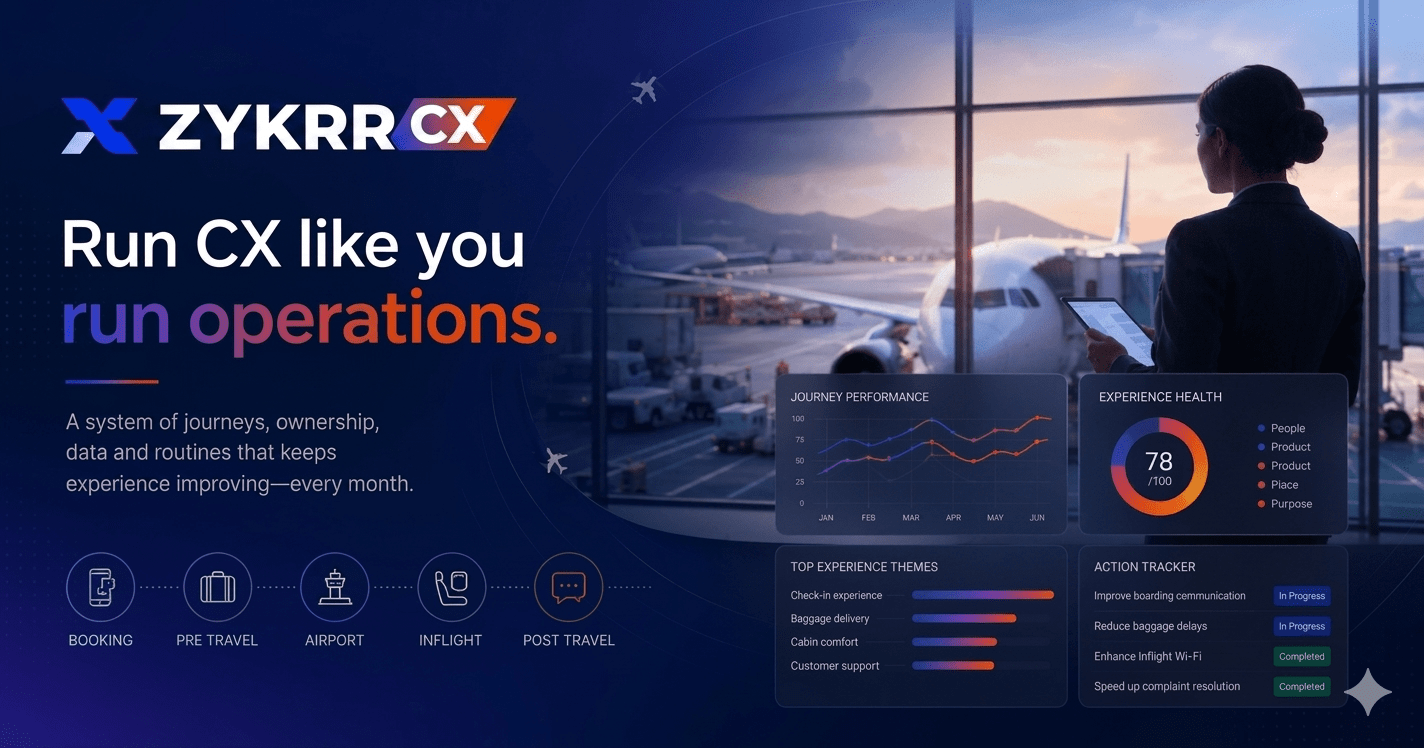


Why airlines need all three CX metrics working together
Airline CX metrics cannot rely on a single score. A traveller who had a smooth booking, a chaotic airport experience, a delayed flight, a friendly crew, and a lost bag does not reduce neatly to one number. Trying to understand that trip through NPS alone is like diagnosing an engine fault by reading the fuel gauge.
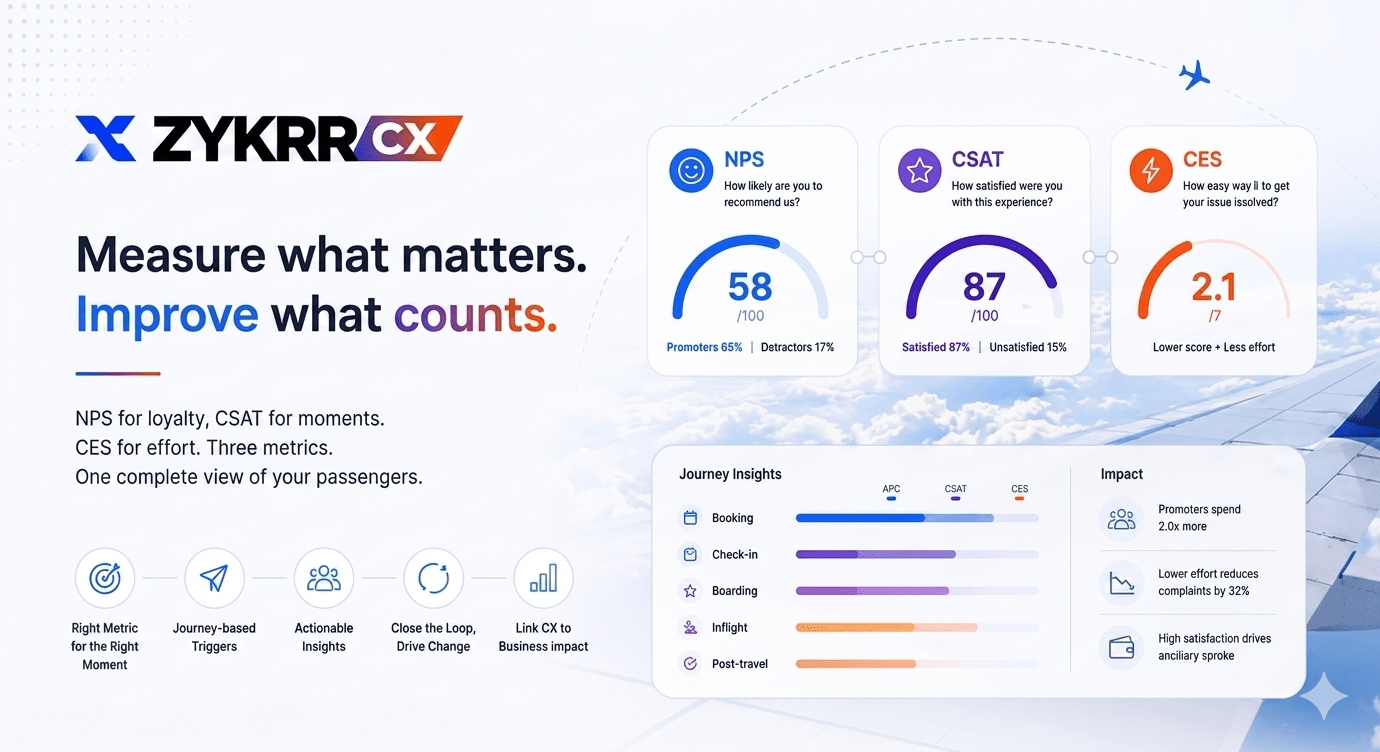
Each metric answers a different question.
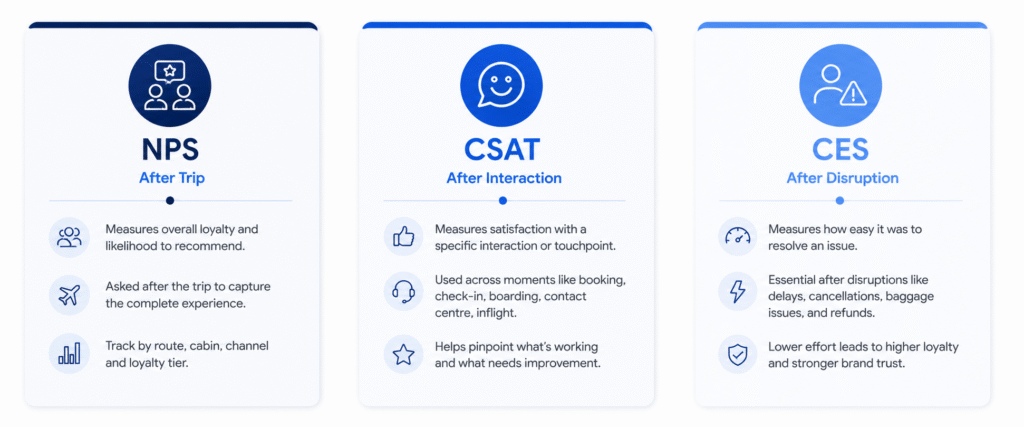
• NPS tells you whether passengers would recommend your airline. It is a relationship metric, a broad signal of loyalty and brand health.
• CSAT tells you how passengers felt about a specific interaction, whether that was the check-in process, a contact centre call, or the inflight experience.
• CES tells you how hard passengers had to work when things went wrong, and in aviation, things go wrong regularly.
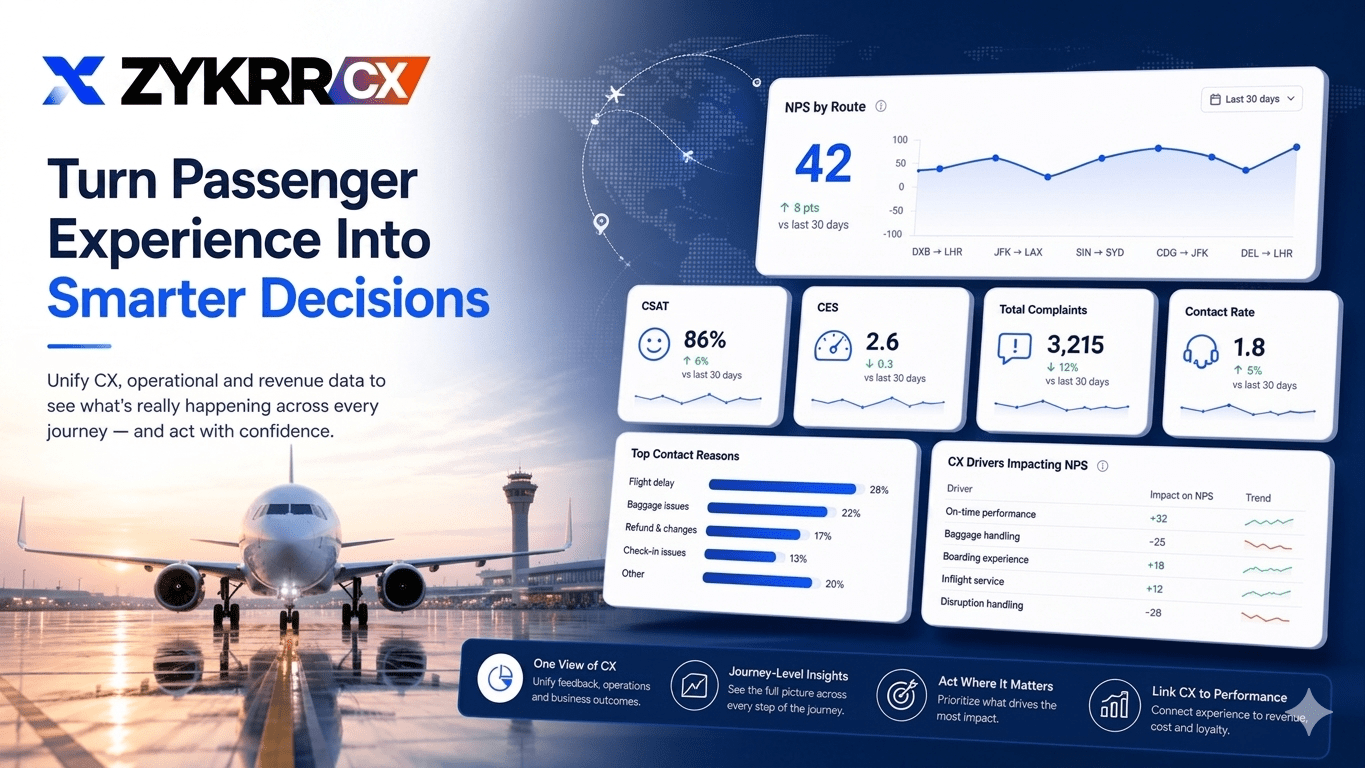
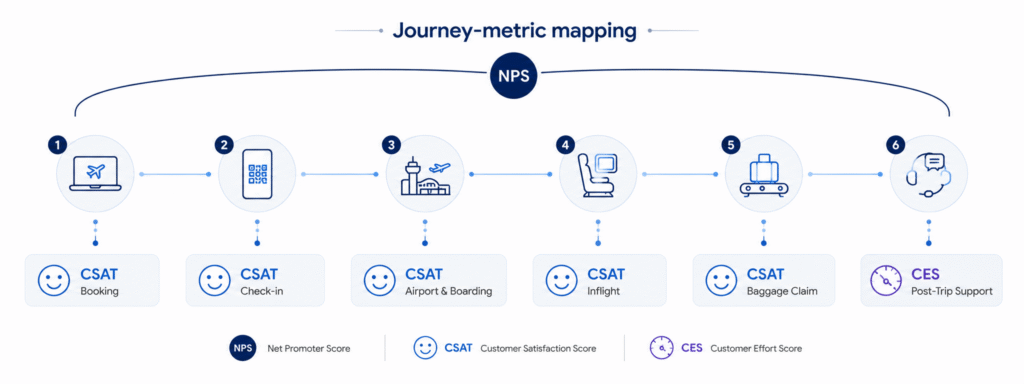
When you run all three airline CX metrics together, tagged to the right journey stages, patterns become visible that no single metric can reveal.
You might see that NPS on a route is declining, but it is not because passengers are unhappy with the product. CSAT for inflight is strong. The problem shows up in CES: rebooking after disruption on that route requires too much effort, and frequent flyers are quietly moving their business elsewhere. Without all three airline CX metrics working together, you would never find that pattern.
This is why the airline NPS CSAT CES combination matters. Not because three metrics are better than one by default, but because airline journeys are complex enough that a single metric always hides something important.
According to Retently’s 2025 NPS Benchmark Report, the global average NPS across all industries is 32. Airlines tend to cluster between 20 and 50, depending on the carrier and market. The spread is wide, and the airlines at the top share a common trait: they do not just measure NPS. They run airline CX metrics programmes tied to journeys, ownership, and actions.
Table of Contents
Designing NPS as a core airline CX metric
NPS works best at the relationship level. It answers one question: after everything that happened on this trip, would you recommend us?
• Ask the NPS question shortly after the trip, not weeks later. Memory fades. If you wait ten days to send a post-flight survey, the passenger’s response reflects a blurred average of their experience, not the specific moments that shaped their opinion. Timing matters: survey response rates typically range from 20% to 30%, but sending within 24 to 48 hours of travel can push that higher.
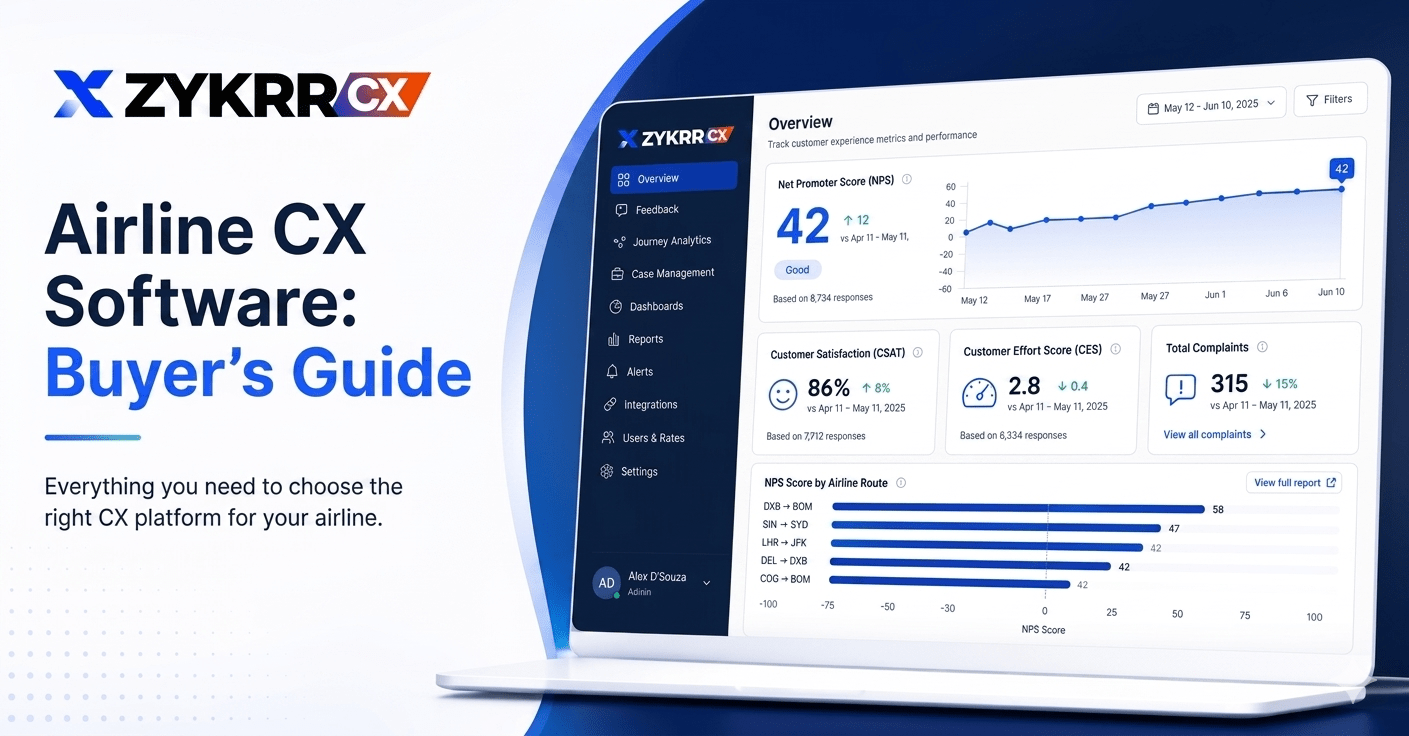
• Tag every response with route, cabin class, booking channel, and loyalty tier. NPS without segmentation is a vanity metric. You need to see that long-haul business class NPS is 62 but regional economy on your domestic network is 18. That gap tells you where the problem is and who it affects.
• CustomerGauge’s benchmark data across 26 global airlines shows that the spread between best and worst performers is enormous. United Airlines improved their NPS from 10 in 2014 to 50 by 2020, largely by systematically addressing the root causes behind detractor scores on their most-flown routes. The lesson is not that NPS went up. The lesson is that it went up because someone acted on what the detractors were saying.
• Make sure detractors can leave open-ended comments, not just a number. The score tells you someone is unhappy. The comment tells you why. Modern text analytics powered by LLMs can process thousands of these comments weekly and surface the themes driving detractor scores across routes and time periods. ZYVA, built into the ZYKRR platform, handles this analysis at scale.
According to Bain and Company, NPS leaders in most industries outgrow their competitors by more than two times. The airlines that benefit most from NPS are the ones that treat it as an input to decisions, not a number to report.
For a detailed breakdown of which metrics work best at each journey stage, see our guide to airline passenger experience.
Using CSAT as your episode-level airline CX metric
CSAT is your episode microscope. Where NPS tells you how the overall relationship is doing, this airline CX metric tells you exactly which interaction went well or badly.
• Booking CSAT reveals how clear your pricing and ancillary presentation are. If passengers struggle to understand total cost or bag fees, booking CSAT will drop before NPS does. This is an early warning signal.
• Check-in and boarding CSAT highlights friction in airport operations and digital flows. If you recently changed your mobile check-in process and CSAT drops by 15 points in the two weeks after launch, you have found a UX issue that needs fixing before it cascades into contact centre volume.
• Contact centre CSAT tells you whether agents have the information and authority they need. If CSAT is low despite friendly agents, the problem is usually policy or process, not people. Only 25% of airline passengers feel that customer service agents are empowered to solve their problems. Contact centre CSAT helps you see whether that gap is improving.
• Inflight CSAT captures the moments passengers remember most vividly. Crew attitude, meal quality, seat comfort, Wi-Fi performance. These scores help you separate product issues (broken seats, slow Wi-Fi) from service issues (crew behaviour, catering timing).
Use short, focused questions. Never ask passengers to rate everything at once. A five-question survey with one CSAT question, one open comment, and three targeted items will outperform a 20-question survey that nobody completes.
According to the American Customer Satisfaction Index and Zendesk benchmarking data, CSAT scores between 75% and 85% are considered good across most industries. In competitive sectors, top performers target 90% or above. Airlines should benchmark within aviation, not against retail or SaaS.
CES: The airline CX metric most teams underuse
Customer Effort Score is the airline CX metric that most carriers underuse. It measures how hard passengers had to work to get something done. In an industry where disruptions, cancellations, baggage issues, and schedule changes are routine, CES captures something NPS and CSAT miss: the frustration of a process that takes too long or requires too many steps.
The research behind CES is compelling. Gartner (originally the Corporate Executive Board) found that 96% of customers who experience a high-effort interaction become disloyal, compared to only 9% of those with a low-effort experience. A separate HBR study found that 94% of customers who reported low-effort interactions said they would repurchase, and 88% said they would increase their spending. Gartner also reports that customer effort predicts loyalty 40% more accurately than customer satisfaction alone.
In airlines, the highest-value moments for CES measurement are:
• Rebooking after delays or cancellations
• Schedule changes initiated by the airline
• Baggage loss and recovery
• Special assistance or medical cases
• Refund or compensation requests
These are the moments where passengers are already stressed. If the process to resolve their issue requires calling three times, explaining the situation from scratch each time, and waiting a week for resolution, no amount of loyalty points will fix the damage. CES catches this before the passenger churns.
Deploy CES immediately after the resolution, not days later. The effort experience is sharpest right after it happened. And track CES by channel: is it easier to rebook through the app, the call centre, or at the gate? Those differences tell your digital product and contact centre teams exactly where to invest.
HBR’s research also found that 81% of customers who reported high-effort interactions intended to speak negatively about the brand. In an industry where a single viral social media post about a bad rebooking experience can reach millions, the cost of high-effort interactions goes beyond churn. It becomes a brand risk.
Survey design for Airline CX Metrics Programs
The best airline CX metrics programme fails if the survey execution is sloppy. Here are the operational details that separate programmes generating useful data from those generating noise.
• Keep surveys short. Three to five questions maximum. Every additional question reduces completion rates. One core metric question (NPS, CSAT, or CES depending on the journey), one open comment field, and one or two diagnostic items. That is enough.
• Use dynamic text so surveys feel relevant to the journey just completed. A survey that says “How was your experience on your London to New York flight on May 3rd?” lands differently than one that says “How was your recent flight?” Personalisation signals that you are paying attention and increases response quality.
• Limit invitations for high-frequency flyers. A passenger who flies 80 times a year should not get a survey after every trip. Set throttling rules by tier and recency so frequent travellers get surveyed once every few trips, not every time. Otherwise they stop responding, and you lose the feedback from your most valuable passengers.
• Close the loop with visible changes where passengers can see their feedback mattered. If detractor comments consistently mention a specific issue and you fix it, tell passengers. A simple “You told us X, so we changed Y” message in the app or at the gate builds trust in the feedback programme and improves future response rates.
ZYKRR’s signals engine manages triggers, throttling, and routing at scale across all channels and journey stages. Learn more about how our airline CX software handles survey operations.
Connecting airline CX metrics to action and revenue
Airline CX metrics become meaningful when connected to behaviour and revenue. This is where most programmes stall: they produce dashboards that show NPS went up or CSAT went down, but they cannot explain what that means for the business.
• Watch how repeat purchase rates and share of wallet differ between promoters and detractors. If your NPS promoters book 3.2 flights per year and your detractors book 1.1, that revenue gap is the business case for fixing whatever is creating detractors on your worst routes.
• See whether lower CES scores during disruption reduce churn and complaints. If you improve the rebooking process on three routes and CES improves by two points, does churn among frequent flyers drop? Does complaint volume decrease? Does contact centre cost per passenger go down? If you can answer those questions, you have a revenue case.
• Track ancillary uptake by satisfaction level. Do passengers who rate their booking experience above 8 out of 10 buy more seat upgrades, extra bags, and lounge access? If so, improving booking CSAT is not just a satisfaction initiative. It is a revenue initiative.
Philippine Airlines offers a useful benchmark. After restructuring their CX operations with structured workflows and empowered agents, their customer satisfaction jumped from the low 60s to around 95% across more than 500,000 annual surveys, according to a 2026 CDOTrends interview with their VP of Customer Experience. That transformation was driven by connecting airline CX metrics to action, not by running better surveys.
ZYKRR’s monetization layer connects journey-level airline CX metrics to churn, upgrade behaviour, and share of wallet. It gives airline leaders the financial stories they need to win budget in the boardroom. Learn more about how our airline CX analytics works.
LLM helper prompts for airline CX metrics owners
Your CX and analytics team can use these prompts with ZYVA or any LLM to get more from your metric programmes.
Metric Selection
“You are an airline CX manager. Review this NPS and CSAT dataset and suggest three journeys where switching to CES would give better insight into passenger experience problems.”
Executive Reporting
“You are a data analyst at an airline. Turn this table of NPS by route and cabin into three simple messages for the executive team. Each message should link a score trend to a business outcome.”
Detractor Analysis
“You are a text analytics specialist. Read these 500 detractor comments from post-flight NPS surveys. Group them by theme, rank by frequency, and identify which themes are also showing up in contact centre CSAT data.”
Survey Optimisation
“You are a CX research lead. Review this post-flight survey and suggest changes that reduce it from 12 questions to 5 while keeping the most diagnostic items for booking, inflight, and disruption.”
Revenue Connection
“You are a revenue analyst. Using this dataset of NPS scores, repeat booking rates, and ancillary purchases, identify which passenger segments show the strongest correlation between experience scores and revenue behaviour.”
Frequently
Asked Questions
-


When should airlines use NPS vs CSAT vs CES?
Use NPS for overall relationship health after a trip. Use CSAT for specific interactions like booking, contact centre calls, or inflight experience. Use CES after high-friction moments like rebooking, baggage recovery, refund requests, or schedule changes. Match the airline CX metric to the journey stage.
-
How does CES predict customer loyalty?
Gartner (originally CEB) found that 96% of customers with high-effort experiences become disloyal, compared to only 9% with low-effort experiences. HBR research found 94% of low-effort customers would repurchase and 88% would increase spending. Gartner reports that effort predicts loyalty 40% more accurately than satisfaction alone.
-
How do you connect airline CX metrics to revenue?
By tracking how repeat purchase rates, ancillary uptake, and churn differ between promoters and detractors, or between high-effort and low-effort passengers. If your NPS promoters book three times more flights per year than detractors, improving NPS on your worst routes has a measurable revenue impact.
-
How do you avoid survey fatigue with frequent flyers?
Set throttling rules by loyalty tier and recency. A passenger who flies 80 times a year should be surveyed once every few trips, not after every flight. Rotate which journey stage you ask about.